
Documentation
Chart images
Draw any chart as a North, South or East Indian chart or a Western wheel, as SVG or PNG, light, dark or print, inline or as a hosted link.
Every capability about a chart can return its drawing as well as its data. The drawings are made by the same engine that computes the chart, so what you show is exactly what the numbers say.
The four styles
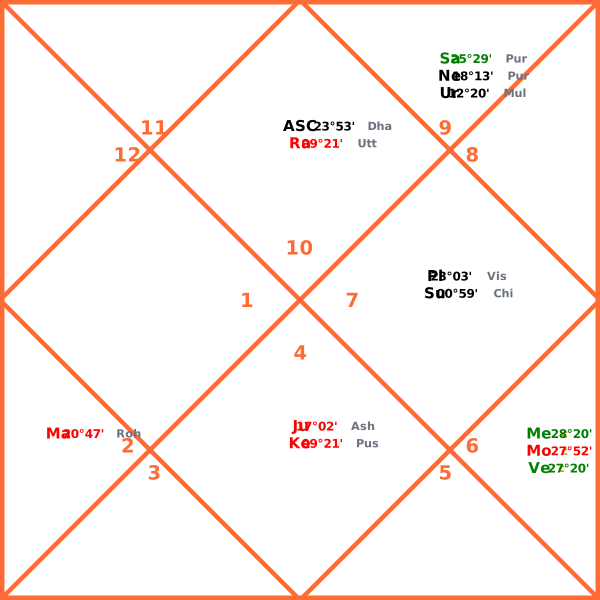
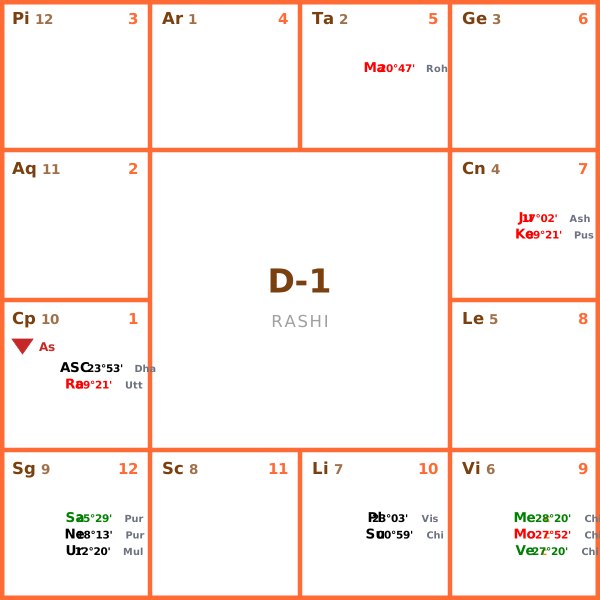
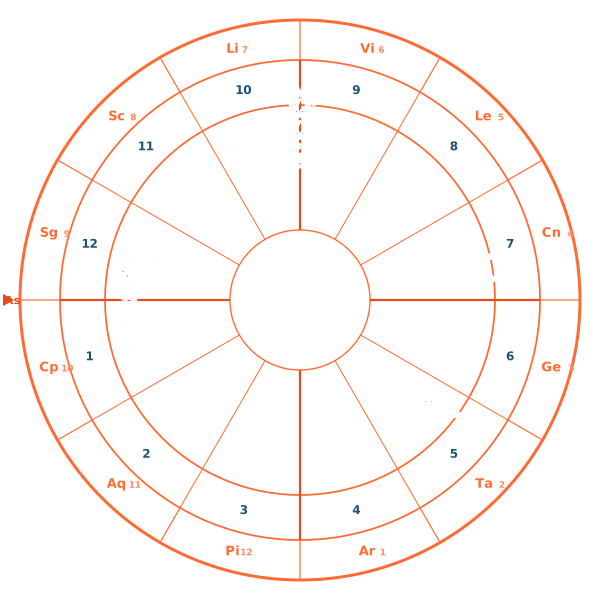
The same sample chart (18 October 1990, 14:30, New Delhi, Lahiri ayanamsha) in each style:
| North Indian | South Indian |
|---|---|
 |  |
| East Indian | Western wheel |
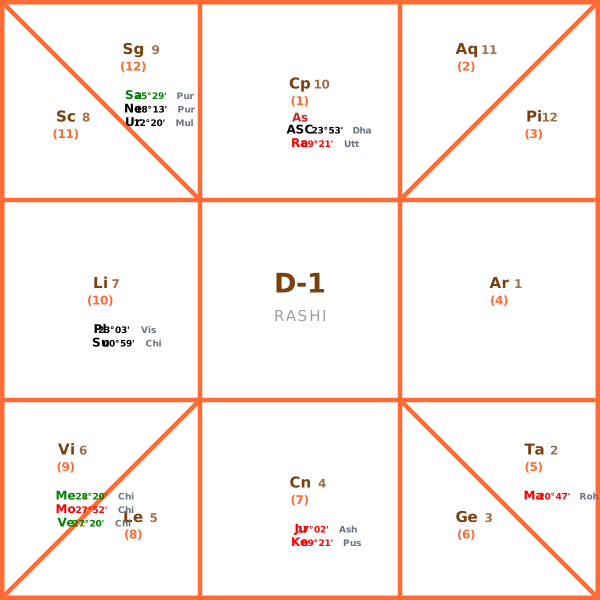 |  |
- North Indian (
north): the houses stay in place and the sign numbers move. The first house is the top diamond. - South Indian (
south): the signs stay in place (Pisces top left) and the houses move with the ascendant. - East Indian (
east): the signs stay in place, read anticlockwise from Aries at the top, as used in Bengal and Odisha. - Western (
western): a wheel with the signs on the rim, the house cusps inside and the ascendant on the left. With a tropical chart it is the usual Western chart; with a sidereal one it is the same sidereal positions drawn as a wheel.
All four use the same colours: planets that help the ascendant in green, those that strain it in red, and degrees with their nakshatra beside each planet.
Getting the drawing
Two ways:
- With the data. On any chart capability, send
"include_image": trueand"image_style"(north,south,eastorwestern). The drawings come back next to the data. See Single endpoints. - Drawings only. Call
vedic-charts/chart-image-styleswithstyleand the charts you want (D1,D9and the other divisional charts):
curl -X POST https://api.96astroapi.com/v1/vedic-charts/chart-image-styles \
  -H "Authorization: Bearer $ASTRO_API_KEY" \
  -H "Content-Type: application/json" \
  -d '{
    "datetime": "1990-10-18T14:30:00", "timezone": "Asia/Kolkata",
    "latitude": 28.6139, "longitude": 77.209,
    "style": "east", "charts": ["D1", "D9"]
  }'
Each image comes back as { "chart": "D1", "style": "east", "format": "svg", "svg": "<svg …>" }.
Format, size, theme and delivery
Four optional fields, all free (the credits are the capability's):
| Field | Values | Use it for |
|---|---|---|
image_format | svg (default), svg_base64, png | svg_base64 and png go straight into an <img src> |
image_width | 200 to 2400 (default 1000) | The pixel width of a PNG |
image_theme | light (default), dark, print | dark for dark screens, print for black-and-white printing |
image_delivery | inline (default), url, both | url gives a short-lived signed link instead of the image itself |
The full rules, including why a raw SVG looks "escaped" inside JSON, are in Requests and responses.
On a website, without code
The Kundli widget draws the birth chart for your visitors. Choose the style with data-chart-style="north", "south" (default) or "east". PDF reports take the same four styles: see Your first PDF report.
Was this page helpful?
Bundles, sections and single endpoints
Ask for everything, one section, or exactly one chart, dosha, koota or table, with the same numbers and a lower price for less.
Classical methods and conventions
How Human Design, Chinese pillars, Ghat Chakra, Ganda Mool, Tajika balas, Pythagorean numbers and other methods are worked out, and where traditions differ.